View box office forecast and results and data from online trends
View General Movie information including synopsis, ratings and a gallery of images and videos
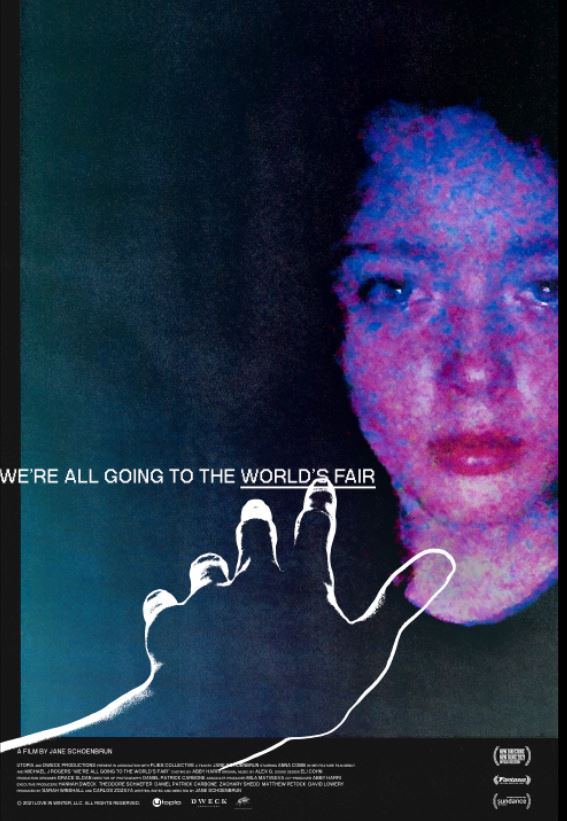
We’re All Going to the World’s Fair
Utopia- 2022
- R
- 1h 26m
- Drama, Horror

Alone in her attic bedroom, teenager Casey becomes immersed in an online role-playing horror game, wherein she begins to document the changes that may or may not be happening to her.
Apr 15, 2022 | Theatrical Limited (9 locations)
Box Office
Results
$12,750
$101,178
$4,163
$105,341
Director & Top Cast
Technical Specifications
Sound Mix: Dolby Digital
Aspect Ratio: 1.78 : 1
Other Details
Country of Origin: United States
Summaries
Plot Summary
Casey, a lonely teenage girl living with her single father, sits in front of her laptop camera, practicing introducing herself and announcing her intent to participate in the viral “World’s Fair challenge.” She turns off all the lights in her bedroom except for her desk lamp before reapproaching the camera holding a stuffed toy lemur. She starts recording a video where she recites her introduction and states her intent to take the challenge, and introduces the lemur toy as “Poe,” whom she says will also be taking the challenge. She says she “doesn’t know what to expect.” She turns off her lamp, says “I want to go to the World’s Fair” three times while staring directly into the camera, and stabs her finger with a pinback button before smearing her blood on her laptop. She then watches a video of colorful, flashing strobe lights, staring unblinkingly into the lights as she does so. She thanks her viewers and promises to post updates if she starts to “notice any changes.”Casey later views other videos related to the World’s Fair challenge. These include a young man who has taken on the challenge and claims he’s “turning into something,” and a video in which a mysterious, distorted voice asks if the viewer wants to join “the internet’s scariest online horror game” before warning the viewer, “we can’t be held responsible for what you become.” The voice also says that “if other players like the direction you’re taking the story, they’ll help you expand it further” – implying that the World’s Fair challenge is merely an elaborate alternate reality game and that all the videos from users who claim to be experiencing “changes” are dramatized. Casey later watches another video of a man sitting on his bathroom floor, stating that a game of Tetris is being played inside of him. Casey pauses the video to look up the most common “symptoms” players have experienced after starting the challenge. She clicks on a video entitled “I can’t feel my body!” uploaded by a user named Keith. In this video, a shirtless Keith is running on a treadmill and repeatedly slapping himself, but appears to show no physical reaction to the stimulus. Another video entitled “I am turning to plastic” then begins playing, of a doll-like young woman with smooth, glistening skin dramatically posing for the camera while ambient pop music plays. As she watches the video, Casey’s father pounds on her door and berates her for watching videos at three o’clock in the morning. Casey apologizes to him and shuts her laptop, but still does not go to sleep.The next day, Casey ventures into the woods near her house, where she continues recording. She explains to her viewers that she took the challenge because she loves horror movies and thought it would be cool to try living life as if she was in one. She explains that she would often sleepwalk as a child and have very strange dreams due to the scary stories she would invent in her head. She also notes that even though the temperature outside is cold, she does not feel anything. At home, she records another video where she says she’s going to film herself sleeping that night. She subsequently gets into bed and struggles for a bit to fall asleep before reapproaching the camera, stopping the recording, and slamming the laptop shut. She puts her hat and coat on and goes outside, carrying a lantern. She approaches her father’s barn, picking the lock to get in, and finds his shotgun. She sits down on the couch in the barn and begins to watch an ASMR video, which she projects from her phone onto the wall, of a young woman soothing the viewer and telling them to go back to bed after they had a nightmare. After the ASMR video ends, another video begins playing, entitled “A message for Casey from JLB,” uploaded by a user called JLB. The video contains a distorted image of Casey’s face that becomes increasingly more disfigured as the video progresses, played over sounds of demonic laughter. The words “YOU ARE IN TROUBLE” and “I NEED TO TALK TO YOU” then flash on the screen.Casey watches one of JLB’s videos, in which he states that he loves collaborating with other players, but warns the viewer that his channel is strictly “in-game” and that only “serious players” are welcome on his channel. Casey calls JLB on Skype. He apologizes for frightening her with his video, explaining that he didn’t know how else to get her attention. JLB then explains that he’s been following her videos and asks how much she’s read up on about the challenge. Casey says she’s only really watched others’ videos on it, and JLB states that the history of the World’s Fair challenge is actually much deeper than it appears. JLB says the challenge is like a conduit that is able to access the players’ subconscious minds, and that he has witnessed it do things to players that Casey could not comprehend. Casey asks why JLB has reached out to her, and he says he wants to help her, but asks her to promise that none of the statements she made in her video in the woods were false. She agrees, but is unable to explain further when JLB prompts her to. Casey says that she can “feel herself leaving her body,” as if the challenge is turning her into a new person entirely. JLB asks her to keep making videos so that he knows she is okay, and she agrees before he ends the call. The movie cuts to a shot of JLB in his own room, revealing him to be a middle-aged balding man. Much like Casey, he spends most of his time watching other World’s Fair videos. He watches a video made by the same man who claimed he could feel Tetris being played in his organs. The man talks about a plush doll of Stitch from Lilo & Stitch he yearned to win from an arcade as a child. He then shows a series of green scales that have begun growing across his arm, and pulls a long strip of arcade tickets from underneath a patch of scales. JLB then plays a pixel game based on the World’s Fair challenge before watching another video. Dramatically shot in the style of a horror film, the video consists of a young man talking to his friend on the phone, imploring him to not watch a video, as “it’s getting stronger.” His friend ignores his behest and performs the same ritual that Casey did at the beginning of the movie. A pair of hands reach out of his laptop screen, cover his mouth as he cries out in horror, and pull him into the laptop. Another video from a user named Rebecca, entitled “Demon Wings,” consists of a young woman staring wordlessly into the camera with a pair of black, feathery wings sprouting from her back.JLB then makes another video for Casey, in which he records a voiceover over one of her videos. Casey’s video is another attempt at recording herself sleeping, as she “needs to figure out what’s going on.” At around 4:55 A.M., by JLB’s estimate, Casey appears to wake up, but does not move at all aside from widening her eyes and grinning madly as her lamp shines on her face. JLB says this video is Casey’s most disturbing one yet, and implores her to continue making them so he can still monitor her well-being. Casey later uploads another video entitled “losing control of myself.” In it, she gleefully sings and dances around her room to a karaoke version of a pop song, but inexplicably begins convulsing and screaming in terror in the middle of the song before continuing to dance as though nothing has happened. She then uploads a video entitled “a tour of my high school,” where she actually just films herself walking through a cemetery and refers to the headstones as lockers, desks, and faculty offices, respectively. Casey’s next upload, entitled “guess where i am today,” consists of her standing on the side of the road and filming cars that go by, ultimately zooming in on an AutoZone across the street. In her next upload, “dumbass waterfall,” Casey films a stream near her house late at night while promising the viewer that someday, she will “disappear,” and nobody will ever be able to discover what has happened to her. In her next upload, “random thought,” Casey films herself walking from a downward angle. She comments on the gun that her father keeps hidden in the barn, and on the fact that he foolishly believes she is unaware he has it. Her next upload, “hey how was your Christmas?”, consists of Christmas lights and decorations that people in her area have put up. She focuses the camera on a wooden cutout of Santa Claus, commands it to “stop smiling,” and insults it.Casey later uploads another video of her sleeping; this is the sixth sleeping video she has made thus far. In the middle of it, she wakes up, eerily crawls towards the camera, and says, “I see you there, even if you won’t show your face. You can’t stop me.” This message is presumably directed towards JLB, who is shown to be watching the video in his own bedroom. JLB makes another video addressed to her, where he admits that he spent most of the holiday season thinking about her and rewatching her videos in search of “clues.” He then states that he senses the “forces of the fair pulling her in closer with each upload,” and that he wants to save her. He asks her to send him a message once she watches his video.In Casey’s next video, her mental state seems to have gone somewhat back to normal. She shuffles a tarot deck and pulls some cards before she explains that the person watching must be a “lonely person” who “seeks comfort in the things they cannot have.” She also states that the viewer struggles with “mental issues,” such as anxiety, and is trying to deceive people by “walking around like they know everything.” She says she hates people like that, then asks the viewer “How strong are you really? How powerful are you really?” She thanks her viewers for watching and ends the video. In her next video, Casey films a walk through her town at night on New Year’s Eve, stating her intention to use her father’s gun to either kill him or herself. She then asks the viewer, “Why won’t you help me?”In her next video, Casey sets up her camera on a tripod in her bathroom and films herself sitting in front of her mirror, smearing toothpaste under her eyes. The video after that consists of Casey with her face and arms completely covered in green glow paint with all the lights in her room off. She holds Poe, her lemur doll, up to the camera and speaks for him in a high-pitched voice, introducing himself to the viewer and saying he loves them. Casey then confesses that she is afraid of the dark and that Poe, who she has had since she was a newborn, helps her sleep at night. She then tears him apart and turns her light back on, but tearfully expresses regret when she sees the ruined toy. She lies down on her floor cuddling the remains of Poe and staring listlessly up at her ceiling.While on another Skype call with JLB, she says she “knows how it’s gonna end now” – she is going to be transported inside her computer. She inquires if JLB is familiar with the strange loop theory, which JLB says is just one theory out of many, but Casey insists that she has always had a looming suspicion that her life has just been one long, continuous dream that she needs to wake up from. JLB then asks if Casey has heard of an entity known as “Ka-Rom,” who aims to “trap” Casey inside the “fairgrounds” and is only deceiving her into believing the strange loop theory to achieve this outcome. Casey asks JLB how much time he estimates is left until she commits suicide. He does not answer, instead saying he needs to ask her a question, but that the two of them need to “go out of game” for him to do so. Casey asks what he means by that, and he explains that they must briefly break character and stop operating as if the World’s Fair is real. Initially appearing upset and confused at the insinuation that the World’s Fair is purely fictitious, Casey agrees. JLB expresses his concern for her, but Casey states that the World’s Fair is a horror game, so it only makes sense that her videos would contain unsettling subject matter. JLB says he is empathetic to her plight, as he himself struggled with suicidal thoughts as a teenager, and admits that he considered contacting the police to do a wellness check on Casey, but refrained because he doesn’t know where she lives. Casey is horrified to learn that JLB assumed her suicidal and homicidal ideations were genuine, and tells him Casey isn’t even her real name before abruptly ending the call. She messages him demanding that he never speak to her again and accusing him of having a pedophilic attraction to her. JLB goes into his living room, where he mutters incomprehensibly to Casey as if she is still there, before going back to his bedroom and trying to call her again. His attempts at contact are immediately rejected. He messages her “please don’t do it,” and asks her to continue making videos.Sometime in the future, JLB makes another video stating that a year after the events of the film occurred, Casey reached out to him on Skype again, whereupon she apologized for distancing herself from him and explained that she spent a few months in a psychiatric institution, and only just recently felt emotionally stable enough to message people again. They shared their real names with one another before Casey revealed she was soon to attend a theater program in New York City. They met in person for the first time in Manhattan, getting coffee and making awkward small talk. As they prepared to part ways, JLB felt confident enough to ask her about the occurrences of that night, but she interrupted him and apologized for the things she had said, which he forgave her for. He then recalls that Casey told him, “That night, I made it there. I know it sounds crazy, but it’s true. I made it there, to the planetarium, across the crowds, into the heart of the fair. But something brought me back. I don’t know what it was.” JLB then confessed he stayed up all night praying for her safety. Casey said she knew, as she could feel it. At that point, they got pizza together and made plans to meet up again to see a movie before sharing a hug and parting ways. Whether or not this meeting actually occurred or is merely a story fabricated by JLB is left unclear.
Storyline
Late on a cold night somewhere in the U.S., teenage Casey sits alone in her attic bedroom, scrolling the internet under the glow-in-the-dark stars and black-light posters that blanket the ceiling. She has finally decided to take the World’s Fair Challenge, an online role-playing horror game, and embrace the uncertainty it promises. After the initiation, she documents the changes that may or may not be happening to her, adding her experiences to the shuffle of online clips available for the world to see. As she begins to lose herself between dream and reality, a mysterious figure reaches out, claiming to see something special in her uploads. — Sundance Film Festival Obsessed with a mysterious online horror game, vulnerable teen Casey plucks up the courage to take the viral World’s Fair Challenge, the internet’s scariest dare. Now, there is no turning back. And as Casey tries to decipher her symptoms, waiting for something to happen, a voice emerges out of the ether, encouraging the shy girl to continue. But is the creepy stranger a friend or a foe? — Nick Riganas

