View box office forecast and results and data from online trends
View General Movie information including synopsis, ratings and a gallery of images and videos
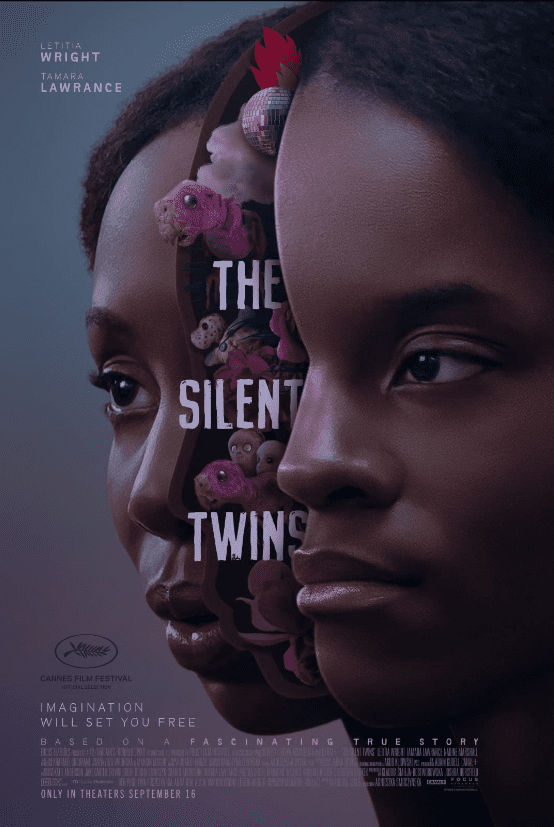
The Silent Twins
Focus Features


Based on the lives of June and Jennifer Gibbons, real-life identical twins who grew up in Wales and became known as "the silent twins" because of their refusal to communicate with anyone but each other.
Release Date
Sep 16, 2022 | Theatrical Limited (279 locations)
Box Office
Results
$103,860
$205,135
$93,072
$298,207
Director & Top Cast
Technical Specifications
Aspect Ratio: 1.66 : 1
Other Details
Country of Origin: Poland
Summaries
Headlines


Videos and Images forThe Silent Twins
Videos
1-0 Of Videos