View box office forecast and results and data from online trends
View General Movie information including synopsis, ratings and a gallery of images and videos
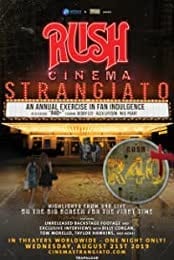
Rush: Cinema Strangiato 2019
Trafalgar Releasing
The Holy Trinity of Rock returns to the big screen on Wednesday, August 21, when the first "Annual Exercise in Fan Indulgence" Cinema Strangiato brings Rush fans together in movie theatres worldwide. Featuring R40+, this global fa...
Release Date
Aug 21, 2019 | Theatrical Limited (3 locations)
Box Office
Results
$2,580
$960,073
$960,073
Director & Top Cast
Summaries
Videos and Images forRush: Cinema Strangiato 2019
Videos
1-0 Of Videos