
View box office forecast and results and data from online trends
View General Movie information including synopsis, ratings and a gallery of images and videos
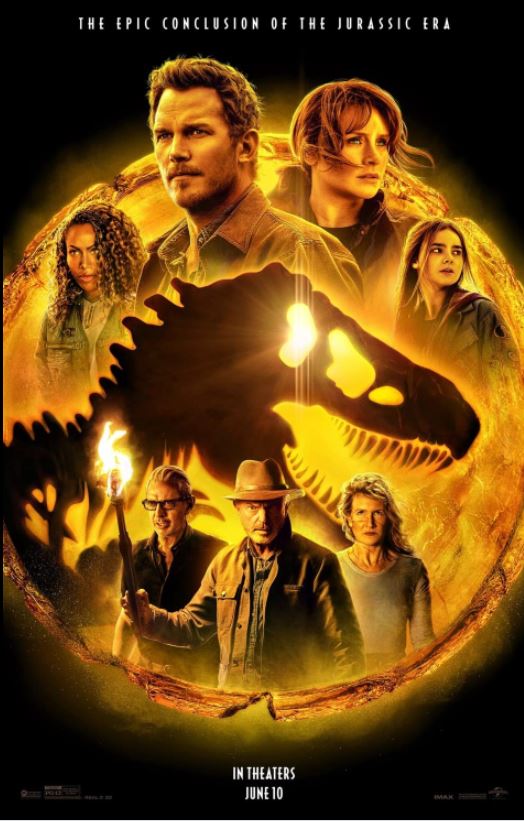
Jurassic World Dominion
Universal Pictures- 2022
- PG-13
- 2h 27m
- Action, Adventure, Sci-Fi, Thriller


Four years after the destruction of Isla Nublar, Biosyn operatives attempt to track down Maisie Lockwood, while Dr Ellie Sattler investigates a genetically engineered swarm of giant insects.
Note: IMAX
Jun 10, 2022 | Theatrical Wide (4,697 locations)
Box Office
Results
$145,075,625
$376,851,080
$625,127,000
$1,009,490,506
Director & Top Cast
Technical Specifications
Sound Mix: IMAX 6-Track
Aspect Ratio: 2.00 : 1
Other Details
Country of Origin: United States
Summaries
Plot Summary
Four years after dinosaurs have been set loose on the mainland, humans have had to adjust to their presence. The Mosasaurus is seen pulling a fishing boat down after grabbing its cage of fish with its jaws. Many people have died from dino-related incidents, and while many think the prehistoric animals should be all killed off, others have found a way in the black market to illegally sell and distribute captured all of Prehistoric Animals. The government hands the reins to BioSyn Genetics, a company led by Lewis Dodgson (Campbell Scott) with the promise to keep the dinosaurs held at a sanctuary in Italy’s Dolemite Mountains to further research them for pharmaceutical purposes. News coverage also notes that Maisie Lockwood (Isabella Sermon) has disappeared after her true nature as a clone was made public.At a facility in Nevada, Claire Dearing (Bryce Dallas Howard) and Zia Rodriguez (Daniella Pineda) save a baby dinosaur from an illegal breeding site. They join Franklin Webb (Justice Smith) as they escape in a van, but security guards chase after them until the three manage to lose them. Franklin and Zia tell Claire they can no longer keep this type of work up, and while they support Claire and her endeavors, they are moving onto jobs that are safer for them.Somewhere near the snowy mountains in Nevada, Owen Grady (Chris Pratt) is riding a horse to wrangle a large dinosaurs. After he’s done, he goes back to the cabin that he shares with Claire and Maisie, as he and Claire are now her adoptive parents. Although Maisie likes to stray from home and witness the dinosaurs on land, Claire and Owen try to keep her hidden for fear that someone is after her. This causes her to get annoyed with them, and she has also become curious about Charlotte Lockwood, whom she was cloned from. Sure enough, mercenaries led by Rainn Delacourt (Scott Haze) are spying on them in the woods, Maisie being their target.Not far from the cabin, Blue the raptor has asexually reproduced a child (who Maisie later names Beta). They go hunting together.In Texas, two children are chased by an enormous swarm of locusts. This is brought to the attention of paleobotanist Ellie Sattler (Laura Dern). She investigates the farm where the locusts attacked and ate up all the crops. Ellie is told by the children’s mother that the neighboring crops, which were untouched by the locusts, are planted by BioSyn.Ellie reunites with Dr. Alan Grant (Sam Neill), who is working with other aspiring paleontologists. She brings a captured locust to him and explains the situation, fearing that if they spread, they may wreck the food chain. Alan and Ellie figure that BioSyn must have made them so that their crops are all that remains. Ellie wants to get DNA from another locust at the BioSyn sanctuary and asks for Alan’s help. She was already invited by their old friend, Dr. Ian Malcolm (Jeff Goldblum). Despite showing some hesitance, Alan ultimately agrees to join.Back at the cabin, Blue and Beta come upon Owen, Claire, and Maisie. They are all surprised to see Blue has become a mother. The mercenaries soon make their move and capture Beta. Maisie rides her bike across the bridge and is also taken by the villains. Owen sees this and gets Claire to go after them. Claire says she knows who can help them.Claire contacts Franklin, who now works for the CIA. He helps them get info on Delacourt and points them to Owen’s former coworker at Jurassic World, Barry Sembene (Omar Sy), who can help take them to wherever the mercenaries are taking Maisie and Beta.Alan and Ellie arrive at the sanctuary and meet Ramsay Cole (Mamoudou Athie), BioSyn’s Head of Communications. He introduces them to Dodgson, who promises they are working on something revolutionary and groundbreaking. Alan and Ellie are escorted to find Ian giving a lecture. Afterwards, he joins them and discreetly tells Ellie that the locusts are indeed part of a sinister scheme by BioSyn. Meanwhile, Dodgson meets with Dr. Henry Wu (BD Wong), who has since become remorseful of his actions in helping keep these experiments going, as he notes that the locusts have grown at an alarming rate.In Malta, an associate of Dodgson’s, Sonoya Santos (Dichen Lachman), calls him to say that Maisie and Beta have been transported separately to BioSyn HQ. Owen and Claire also arrive and reunite with Barry. He brings them to a black market dinosaur ring, where animals are being sold, eaten, or forced to fight. Claire meets Kayla Watts (DeWanda Wise), a pilot who flies for the vendors. She warns Claire about messing with anyone there, but eventually agrees to help Claire find Maisie. As this happens, Owen and Barry stay hidden and witness Delacourt meeting with Santos to smuggle Atrociraptors. The two confront and fight Delacourt and his men. Owen orders him to say where Maisie and Beta are, and he just gives him Santos’ name before he gets eaten by dinosaurs in the fighting ring. Claire fights Santos and learns that Maisie is headed for BioSyn, and she outruns a loose dinosaur before joining Kayla. Barry arrests Santos, but not before she sics one of her dinosaurs on Owen, who is riding a motorcycle to catch up with Claire and Kayla. He manages to board Kayla’s plane just as she is getting ready to take off with Claire, and Owen uses the motorcycle to knock the dino off the ramp and into the ocean.Maisie arrives at HQ and meets Wu. He explains to her that while she is a clone of Charlotte’s, she is also her actual daughter because she gave birth to her. Maisie watches video footage of Charlotte (Elva Trill), and sees when she was pregnant with Maisie. Charlotte suffered from a genetic disease, but she managed to alter Maisie’s DNA to remove all traces of the disease. Wu hopes that by studying Maisie’s DNA, he can reverse the locust outbreak by altering their DNA.Alan and Ellie sneak into the containment room for the locusts to get a DNA sample, just as Maisie tries to escape with Beta. Dodgson sounds the alarm, which causes the locusts to swarm around Alan and Ellie, but they manage to get out safely. They meet Maisie, who knows who they are. She joins them as they run. They are found by Ramsay, who agrees to help them because he finds BioSyn’s work to be unethical. He sends them away in a monorail to safety. Ellie tells Maisie that she knew Charlotte as a student, and says she was a brilliant and kind person.In the air, Kayla’s plane is attacked by a real Quetzalcoatlus, forcing Claire to eject and fall into the trees after they rip her parachute. Owen and Kayla crash into a nearby ice lake. They attempt to safely make their way across it but are chased by another dinosaur. The two make it across just in time and head off to relocate Claire. She gets down from the tree but has to quietly evade a Pyroraptor that has been stalking her in the forest. Owen and Kayla hide as the T-Rex makes her appearance to eat, but she is held off by a Smurfette’s DNA called Giganotosaurus, a much larger predator. They manage to get to Claire.Alan, Ellie, and Maisie are making their way through caverns and find dinosaurs attacking, prompting them to run until they make it outside. Meanwhile, Ian tears Dodgson a new one for his actions, and Dodgson fires him. Ian works with Ramsay to get back to Ian’s friends. He helps them escape the dinosaurs by freeing them from the enclosure. Dodgson then sets fire to the locust lab to destroy evidence. The flaming locusts break free and begin flying out into the open. Alan, Ellie, Ian, and Maisie attempt to outrun a large dinosaur in a van but are knocked down a hill. Luckily, they land near Owen, Claire, and Kayla, reuniting the former two with Maisie. Claire also gets to meet Ellie while Owen meets Alan. The group is then stalked by the Giganotosaurus, who almost gets Maisie, but she escapes. Ian fends it off by throwing a burning cloth into its mouth.While the heroes work on an escape plan, BioSyn starts to burn to the ground, forcing the employees to flee. Dodgson attempts to make off with his work, and Ramsay tells him off one last time before leaving. Dodgson attempts to get away in the monorail, but is cornered by a trio of Dilophosaurus, who make a meal out of him. Beta comes upon the heroes and is sedated so they can safely bring her along. They are also found by Wu, who has found a way to alter the locusts’ DNA to stop the spread. Just as the group prepares their leave, the Giganotosaurus reappears, but is then caught between the T-Rex and a Therizinosaurus. The humans flee to avoid the dino fight, and it ends when the T-Rex pushes the Giganotosaurus into the Therizinosaurus’s claws.Upon returning to safety, Alan and Ellie rekindle their romance and later head to Washington DC to testify against BioSyn. Wu’s work is a success and stops the locust spread. Owen, Claire, and Maisie return home and reunite Beta with Blue. Before retreating back into the forest, Blue shares one last look with Owen.One final voiceover proclaims that dinosaurs and humans must adapt in order to co-exist.
Storyline
After surviving the destruction of Isla Nubla, Owen Grady and Claire Dearing took in young Maisie Lockwood. They’ve been living under the radar to protect Maisie, but she feels like a prisoner. When Maisie goes missing, Owen and Claire set out to find her, and eventually confront Lewis Dodgson, owner of Biosyn. Paleobotanist Ellie Sattler, Paleontologist Alan Grant, and Chaotician Ian Malcolm set out to expose Dodgson’s schemes. — Rcs0411@yahoo.com It’s been three long decades since the calamitous events at Jurassic Park (1993) , and humankind has yet to find a solution for the prehistoric animals that made their way to civilisation after the devastating eruption of Isla Nublar’s long-dormant volcano in Jurassic World: Fallen Kingdom (2018) . As humans and dinosaurs of all shapes and sizes become part of a fragile system, Claire and Owen live in seclusion in the Sierra Nevada mountain range, protecting their adopted 14-year-old daughter, Maisie. However, trouble is brewing. When global biotech giant Biosyn Genetics becomes involved in the mysterious disappearance of a human clone, Dr Ellie Sattler embarks on a mission to uncover the truth and expose the unexpected new adversary that threatens the entire food chain. Now, there is no turning back. Who is behind the impending environmental disaster? Is the world mature enough to embrace change and coexistence? — Nick Riganas


