View box office forecast and results and data from online trends
View General Movie information including synopsis, ratings and a gallery of images and videos
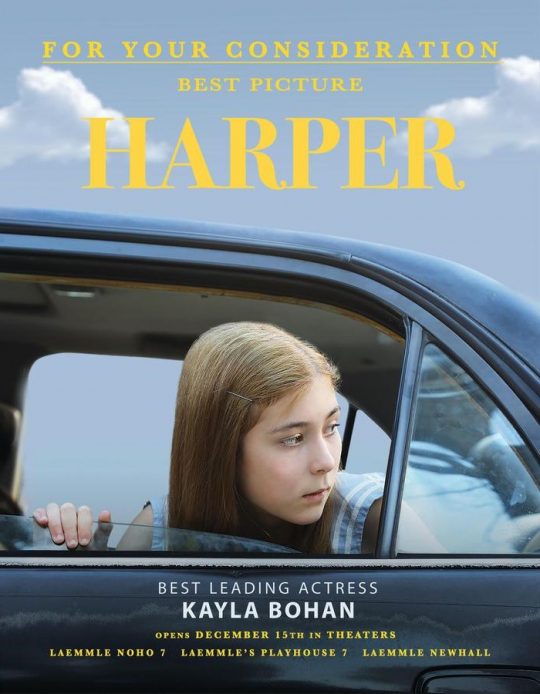
Harper
Indican Pictures
HARPER, an 11 year old girl's life is shattered when her father dies suddenly. Sent to live on a dilapidated farm with an Aunt she's never met, Harper must adjust to her new reality. However, just as she settles in, ISABELLA, her ...
Release Date
Dec 15, 2021 | Theatrical Limited (5 locations)
Box Office
Results
$10,170
$20,268
$20,268
Director & Top Cast
Other Details
Country of Origin: United States
Summaries
Headlines


Videos and Images forHarper
Videos
1-0 Of Videos